Language and Logic Dynamics ultra basic crash course
In late 2017, me and my research partner started working on the Language and Logic Dynamics project after we both noticed there was something weird going on with different groups of people and how they thought so similarly and how these groups had a very difficult time talking with one another. It all started with politics but has gone much deeper. We found that the political spectrum is an emergent spectrum of beliefs from a spectrum of just beliefs themselves. We call that spectrum the Conceptual Map. The Political Map, commonly called the political spectrum or political compass, sits on top of that Conceptual Map.
This page exists because I’ve had to reconstruct this basic crash course of information multiple times and wanted to not do that anymore. There is a massive amount of information related to the project but this is always what seems to be the go to that works fairly well in describing just the surface level of the Language and Logic Dynamics project.
What you will find in this post:
- 6 images with some associated text to explain the graphics a bit
- 1 video conversation of me and research partner talking with Benjamin Boyce in late 2017 talking about our early findings
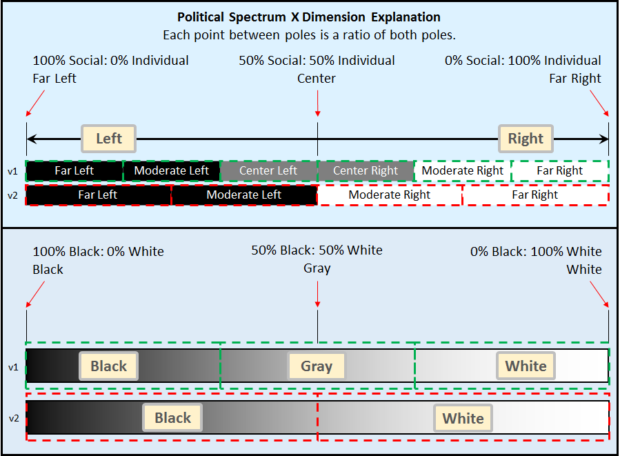
Image 1
The extreme polar end traits are what is below. There is a mixture between the two poles for everyone between the two polar ends. The graphic shows how spectral categorization is done with an example and with the left right dimension of the political spectrum.
Liberal and Conservative terms used below are based on the persistent political system, not any particular location or time period.
- Liberal: Idealism, social, a priori, postmodernity, nebulization, holism, systems, fear aversion, harm and care based morality, hard boundaries, universal groupings
- Conservative: Realism, individual, a posteori, modernity, consolidation, reductionsim, components, threat aversion, justice and rule based morality, hard boundaries, use general groupings
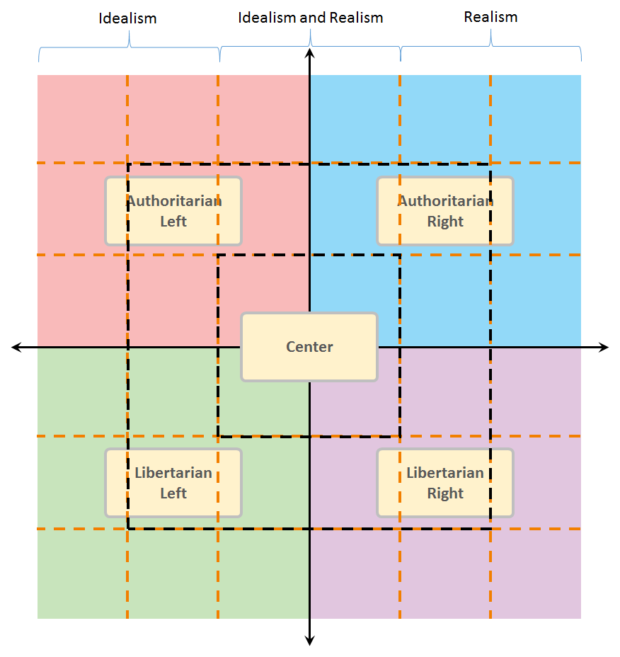
Image 2
This shows the spectrum has left, center, right zones. Also that there are smaller zones within those three zones. That is also shown in image 1.
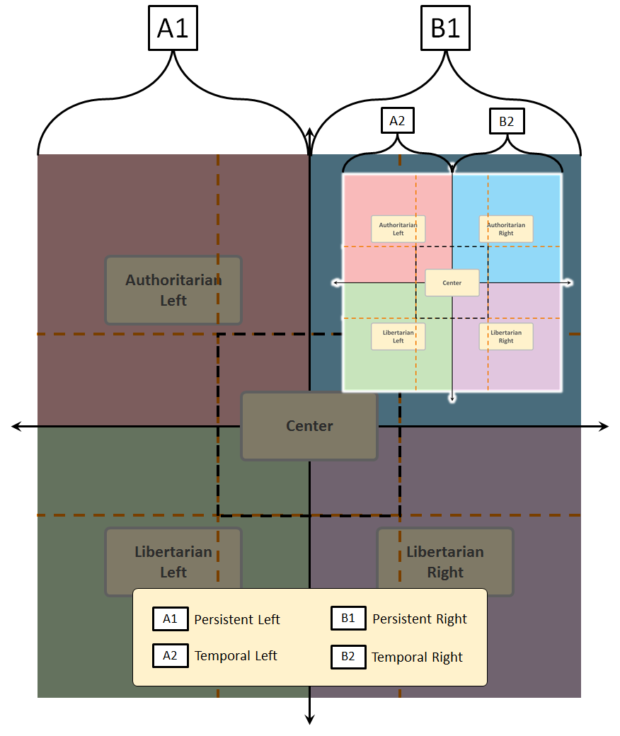
The temporal political spectrum is what is normally called the overton window. That would be the brighter and smaller political spectrum showed with A2-B2. The persistent political position is A1-B1 and is all of the positions possible at any time, any location.
This is basically because the political spectrum is a version of the conceptual spectrum. A spectrum of all possible conceptions about a particular thing.
The overton window tends to be the bounded amount of ways a concept can exist within a time and location due to information available, cultural pressures, etc.
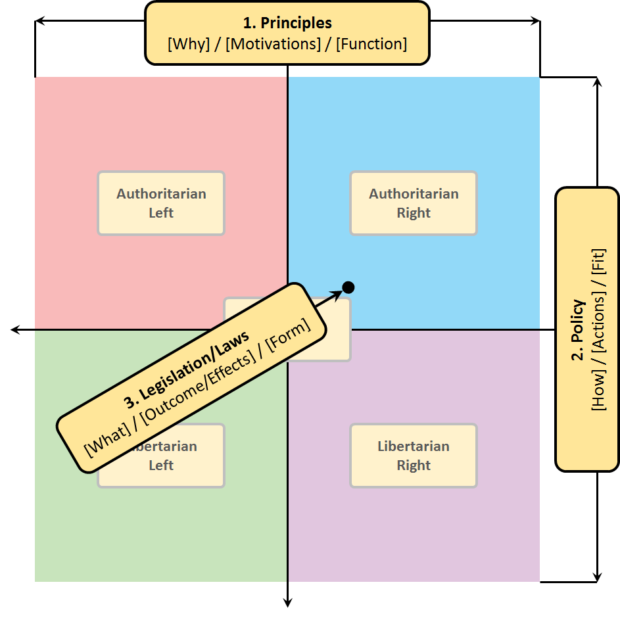
This shows that the left and right spectrum is about the factors that go into a conception. Things that are listed under image 1.
The vertical is all about the confidence in the conception and application to society because of that confidence level in the conception held.
That ends up with the legislation location that is a combination of the two axii.
Image 5
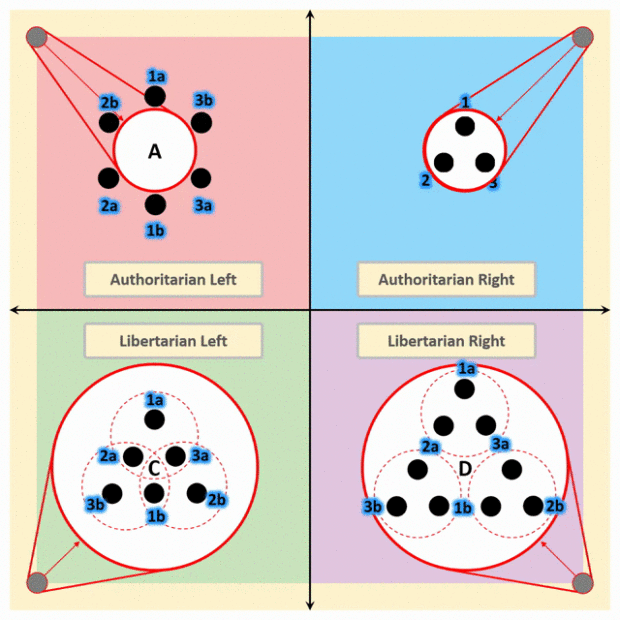
The animation depicts four maximum states of concept formations.
Red circles are concept boundaries. Black dots are traits. A good example is a word and the word’s definition. Example:
Definition – the degree of distinctness in outline of an object, image, or sound, especially of an image in a photograph or on a screen.
“Definition” is the red circle.
“the degree of distinctness in outline of an object, image, or sound, especially of an image in a photograph or on a screen.” are the traits inside the red circle.
- Authoritarian Right – Simple with few traits bound together into a conception.
- Authoritarian Left – A conception with many associated traits orbiting it.
- Libertarian Left – A quantum belief that has all possible permutations of concept formations created by all of the associated traits that were orbiting the conception in Authoritarian Left.
- Libertarian Right – A conception cluster that is all of the possible permutations from Libertarian Left but made as coherent options.
What is happening is that a known concept is being broken apart into its trait components and those trait components being broken apart. Basically the post-modernism concept. Then the information is being made more and more coherent as you move through libertarian left, libertarian right, and authoritarian right. At the authoritarian right position the information has been sorted through and reintegrated into a more refined concept. The animation is simplistic and does not show everything that happens. When the process is happening often a concept will often remove some invalid information and introduce more valid information. So a concept may become two more distinct concepts or may shrink or may get bigger in order as an effect of being more refined.
The animation was designed to show the progression but mainly to show the stages inbetween each maximal position. It becomes more complicated in real life as people are unable to operate or exist at these maximal positions. People exist and operate somewhere between the maximal points which are the corners of the graphic.
NOTE: Click image to see animated gif version.
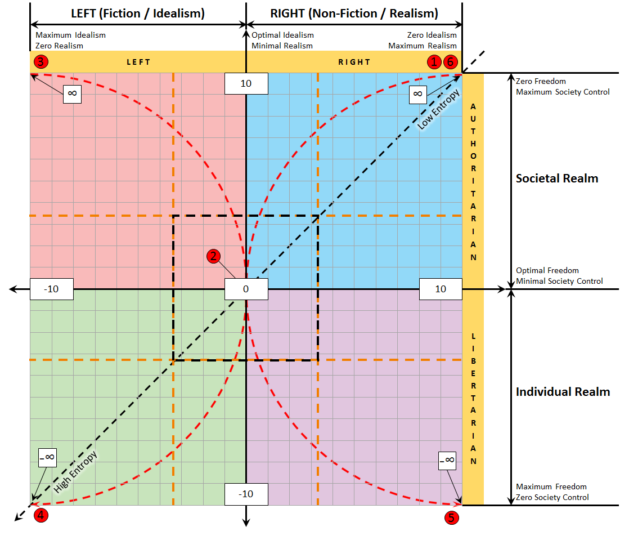
This graphic displays a lot of information that I won’t be writing all out here. Some will have to be inferred from previous information on this page. The image shows an entropy curve from top right to bottom right. Then there is a mirrored version on the left. There is also a straight line that starts at the top right and goes through the bottom left. This shows entropy of information from low entropy to high entropy. Please relate this concept to Image 5 contents.
The Realism and Idealism labels on the image are philosophical types. It is about foundations of conceptions.
If you would like to see an early conversation that me and my research partner had with Benjamin Boyce, you can see that below.
source: [https://youtu.be/MgVOO-m00kU]
[arve url=”https://www.youtube.com/watch?v=MgVOO-m00kU” align=”center” /]
